
HRV Information Guide
All iSync devices include built-in HRV measurement via an integrated PPG (photoplethysmography) sensor. This is a reference guide to iSyncHeart's individual patient reports and normative population benchmarks — covering core HRV parameters, AI-driven stress staging, and mental health screening models.
Unlocking HRV: A Deep Dive into Heart Rate Variability with iSyncHeart
General Notes
Source Standards
Most HRV parameters used in iSyncHeart reports are derived from the landmark consensus paper: "Heart Rate Variability: Standards of Measurement, Physiological Interpretation, and Clinical Use" — the foundational reference for all modern HRV research.
PPG Sensor Methodology
Because iSyncHeart uses a PPG (photoplethysmography) sensor rather than an ECG electrode, R-peaks are located by taking the derivative of the PPG signal — the point where the derivative is at its maximum corresponds to the R-peak. All HRV calculations then use these R-R intervals.
Normative Database
The normative database was built from 5-minute recordings. For the most accurate percentile comparisons, a 5-minute recording is strongly recommended. Shorter recordings may still provide useful clinical information but will have wider confidence intervals.
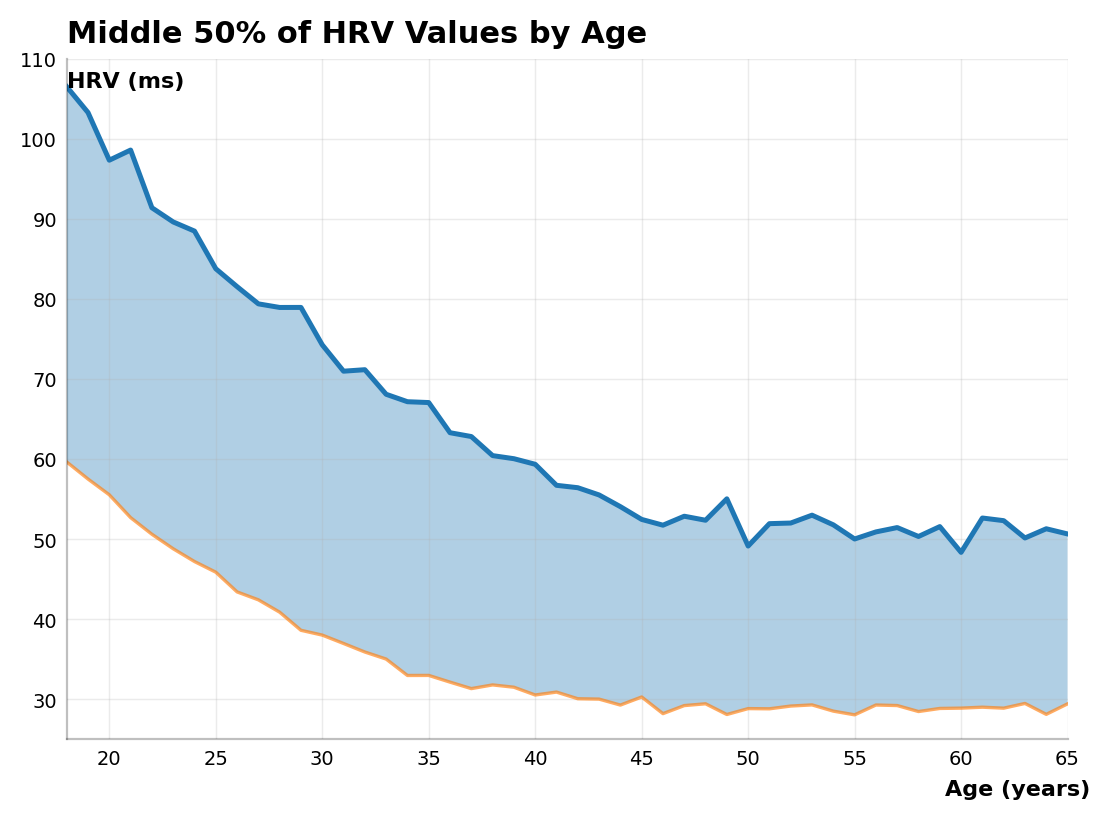
Normal HRV Declines with Age
It is well established that HRV naturally decreases as a person ages. For this reason, iSyncHeart's normative database is stratified by age group, ensuring that a patient's percentile ranking is always compared to healthy peers of the same age — not the general population. Clinicians should interpret all percentile values in the context of the patient's age-specific normative range.
Normative Report Contents
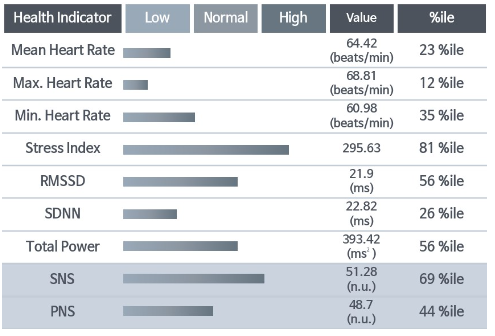
The HRV Comprehensive Analysis Result section of the iSyncHeart report presents a summary of values derived from both time-domain and frequency-domain analyses. Each parameter is benchmarked against age-matched healthy normals from the iMediSync normative database.
Example Report Output
HRV 2D Analysis
The 2D analysis plot positions the individual subject against the normative population distribution. The X-axis represents SDNN (HRV proxy) and the Y-axis represents Mean Heart Rate, together characterizing general cardiovascular and autonomic health.
Example Report Output
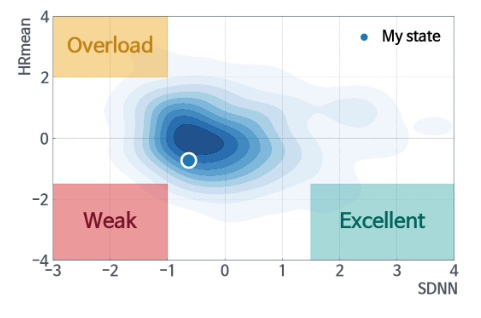
Each quadrant represents a distinct physiological profile. "Excellent" (low resting HR + high HRV) reflects the strongest autonomic adaptability.
HRV Histogram
The HRV histogram displays the distribution of inter-beat intervals, grouping the number of heartbeats into frequency "buckets" of approximately 4 ms each. A wider, more spread-out distribution indicates greater HRV; a narrow, peaked distribution indicates lower HRV. Three zones classify the result.
Example Report Output
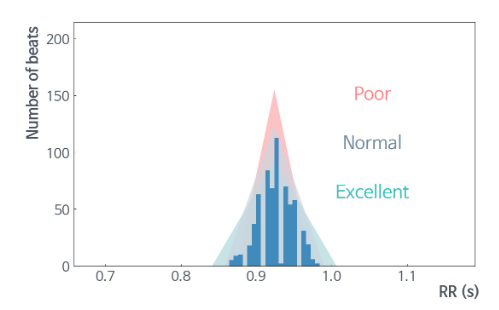
Narrow distribution — low variability between beats. Suggests reduced autonomic flexibility and elevated stress or dysfunction.
Moderate spread — typical autonomic activity for age. Represents an acceptable level of heart rate variability for most healthy adults.
Wide distribution — high beat-to-beat variability. Indicates strong autonomic resilience, parasympathetic dominance, and cardiovascular fitness.
AI Analysis: Five Stages of Stress
iSyncHeart's ML algorithm analyzes the PPG rhythm pattern using six input features — SNS index, PNS index, Mean HR, SDNN, Stress Index, and age — to classify each recording into one of five physiological stress stages. This model is grounded in the work of Hans Selye, the Austrian endocrinologist who pioneered the science of biological stress response.
Example Report Output
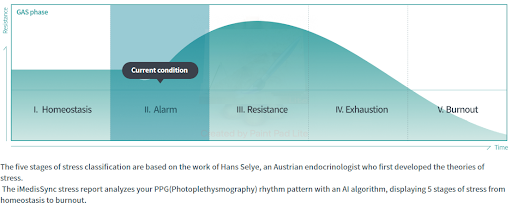
Homeostasis
Baseline physiological equilibrium. The autonomic nervous system is balanced and adaptive. HRV parameters are within healthy normative ranges for the individual's age.
Alarm
Initial stress response — the body recognizes a stressor and begins mobilizing resources. Sympathetic activity begins to rise, with early HRV changes detectable.
Resistance
The body actively adapts to sustained stress. Cortisol and sympathetic tone remain elevated. HRV shows measurable reduction from baseline homeostasis.
Exhaustion
Adaptive reserves are significantly depleted. Both SNS and PNS may show dysregulation. SDNN and RMSSD are markedly reduced, indicating compromised resilience.
Burnout
Chronic physiological breakdown. The autonomic system can no longer mount an adaptive response. HRV is severely suppressed. Clinical intervention is strongly indicated.
AI Sensitivity Analysis: Depression & Anxiety Screening
Peer-reviewed research demonstrates that measurable changes in HRV parameters are a defining biomarker trait linked to both depression and anxiety disorders. iSyncHeart leverages this evidence base in two distinct ML models, each trained on over 400 individuals using standardized clinical testing protocols.
Depression Screening Model
Uses HRV-derived features to screen for the likelihood of clinically significant depression. The high PPV for the clinical class means a positive screen carries strong signal — minimizing false positives for the highest-risk category.
Anxiety Screening Model
Screens for anxiety-spectrum autonomic signatures using HRV patterns that diverge from healthy normative profiles. Designed as a clinical triage aid, not a diagnostic replacement for standardized psychological assessment.
These AI screening models are intended as clinical decision support tools only. Results should always be interpreted by a qualified clinician in the context of a full patient history and standardized diagnostic criteria. They are not a replacement for DSM-5 or ICD-based diagnosis.
See iSyncHeart in Your Practice
Explore the full iSyncHeart product page or schedule a personalized demo to see how HRV analysis integrates into your clinical workflow.